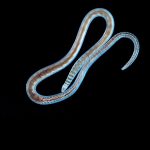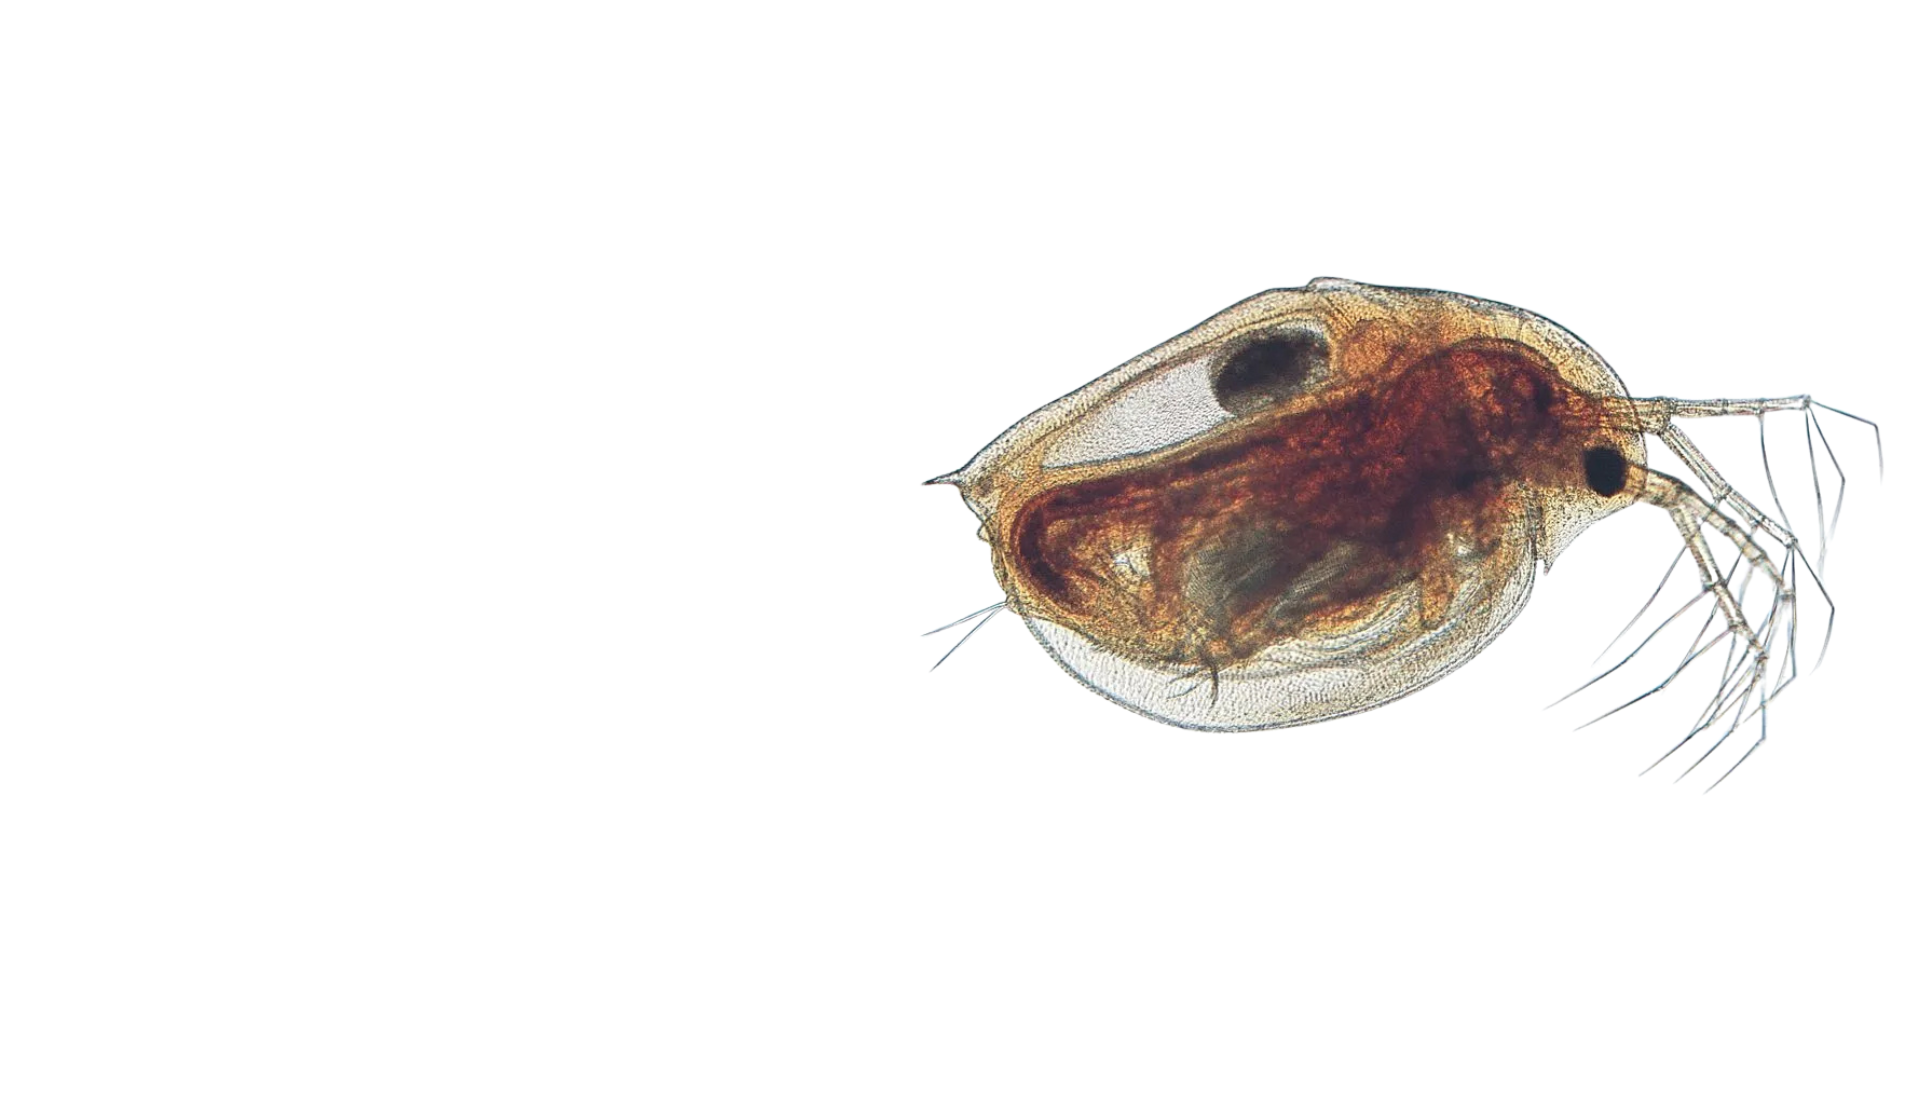
In this lab students study the hatching of brine shrimp eggs and design an experiment to see what factors influence hatching. Brine shrimp, genus Artemia, are found in saline lakes on all continents except Antarctica. They tolerate a wide range of salt concentrations. Brine shrimp produce two different types of eggs. In addition to thin-shelled summer eggs that develop at a steady rate and then hatch, they produce thick-shelled winter eggs in which development of the embryo is arrested at a certain stage. These eggs, also called cysts, can survive harsh conditions (such as drought) for long periods of time and then resume development and hatch when environmental conditions are favorable. Both types of brine shrimp eggs hatch into larvae called nauplii.
Determine stream water quality based on a macroinvertebrate inventory.

Brine shrimp eggs hatch in about 2 days when put in a weak salt solution.
Ensure that students understand and adhere to safe laboratory practices when performing any activity in the classroom or lab. Demonstrate the protocol for correctly using the instruments and materials necessary to complete the activities, and emphasize the importance of proper usage. Use personal protective equipment such as safety glasses or goggles, gloves, and aprons when appropriate. Model proper laboratory safety practices for your students and require them to adhere to all laboratory safety rules.
Students may work individually or in groups of two or four.
Brainstorm factors that might influence hatching success of brine shrimp eggs. (Examples include the effects of salt concentration, light exposure, temperature, pH, and presence of various chemicals, such as alcohol or detergents.) After the brainstorm, students design their experiments and present their plans for your approval, including their materials lists. Be certain that all needed materials are available, are safe for students to use, and are not restricted by your school district. Each plan should note how each hatching chamber will be marked for identification. Each group may run one control chamber and one experimental chamber, or one group might run control chambers while the others run experimental chambers. You may decide for all groups to test variations of the same factor, e.g., salt concentration.
It is best to set up hatching chambers on a Monday so that students can record hatching data for 4 consecutive days. They can then analyze their data and present their reports the following week.
To simulate natural seawater, which contains about 3.5% or 35 ppt (parts per thousand) dissolved salts, dissolve 35 g of synthetic sea salt or non-iodized table salt in water to make 1 L of solution. Use this as the standard salt solution for hatching eggs. (Brine shrimp eggs will hatch in water several times saltier than that.) In preparing the solution, use springwater or tap water that has been treated to remove chlorine and chloramine. About 30 mL of solution is needed for each hatching chamber.
Set up one or more of the following workstations.
Chamber Preparation:
petri dishes
marker
double-sided tape
sheet of transparency film
hole punch
scissors
Egg Pickup:
vial or dish of brine shrimp eggs
small paintbrush
Brine shrimp removed from the hatching chambers during counting can be fed to aquarium fish or killed by discarding them into a vial of alcohol. A student may be interested in growing them to adulthood as a special project. See our Brine Shrimp CareSheet for culture methods.
The data shown below are for a control group of 46 eggs hatched in a standard 3.5% marine salt solution at 25°C and pH of 7. Depending on your students’ abilities, you may have them design their own data tables, the class may brainstorm a data table design, or you may suggest the design shown in the sample tables that follow. Notice that the raw data is converted to “% Hatched” to account for variation in the initial number of eggs. Although the same data is used in both tables, Table 1 is based on the number of eggs hatched per 24-hour period, and Table 2 is based on the cumulative numbers of eggs hatched. When graphed, Table 2 gives a clearer view of hatching rate. Table 1 gives a better view of the time period during which the most eggs hatched and produces a very different graph from a graph of Table 2’s data.
Students can pool the data from their experiments and posit an ideal set of conditions for hatching brine shrimp eggs.
Sample Data Table 1
Initial number of eggs 46
| # Larvae Hatched | % Hatched | |
|---|---|---|
| Day 0 | 0 | 0% |
| Day 1 (24 hrs) | 20 | 43% |
| Day 2 (48 hrs) | 12 | 26% |
| Day 3 (72 hrs) | 5 | 11% |
| Day 4 (96 hrs) | 2 | 4% |
Sample Data Table 2
Initial number of eggs 46
| # Larvae Hatched | Cumulative # Hatched | Cumulative % Hatched | |
|---|---|---|---|
| Day 0 | 0 | 0 | 0% |
| Day 1 (24 hrs) | 20 | 20 | 43% |
| Day 2 (48 hrs) | 12 | 32 | 70% |
| Day 3 (72 hrs) | 5 | 37 | 80% |
| Day 4 (96 hrs) | 2 | 39 | 85% |
Get the latest news, free activities, teacher tips, product info, and more delivered to your inbox.