Objective
To observe hydrogen’s emission spectrum and to verify that the Bohr model of the hydrogen atom accounts for the line positions in hydrogen’s emission spectrum.
Introduction
Bohr’s model of the atom explains hydrogen’s spectrum but does not satisfactorily explain atoms that have more than 1 electron and proton and is, therefore, not the currently accepted model for all atoms. However, it does contain important features (e.g., quantized energy states) that are incorporated in our current model of the atom, and it does account for the line positions in hydrogen’s emission spectrum, which is important for this experiment. Consequently, the Bohr model retains a place in chemistry courses, even though it cannot be applied to other atoms.
In Bohr’s model, a hydrogen atom consists of a central proton about which a single electron moves in fixed spherical orbits. Bohr related the proton’s electrostatic attraction for the electron to the force due to the electron’s orbital motion. He was able to express the electron’s energy in terms of its orbital radius in a purely classical treatment based on Coulomb’s law of electrostatic attraction. He departed from classical theory, however, by imposing a “quantum restriction” upon the condition that the electron could exist only in certain “allowed states.” The energy could have only those values given by the equation:
BH is a constant (2.18 x 10⁻¹⁸ J/particle) that can be calculated from electrostatic theory, and n is called the principle quantum number.
In setting up his model, Bohr designated zero energy as the point where the proton and electron are completely separated, level infinity. This energy level represents the highest potential energy state. Moving the electron to any of its lower allowed energy states within the atom results in a decrease in potential energy; a release of energy; and an energy level below zero, i.e., negative. Hence the minus sign in the above equation.
In the normal hydrogen atom, the electron is in its “ground state” for which n = 1. When the atom absorbs energy, as it does when placed in an electrical discharge or flame, its electron moves to a higher allowed energy level and the atom is said to be in an “excited state.” In a hydrogen atom’s first excited state, n = 2; in its second, n = 3; and so on. When an excited-state electron drops back to a lower-energy state, it releases potential energy in the form of light. Some of the possible transitions are shown below.
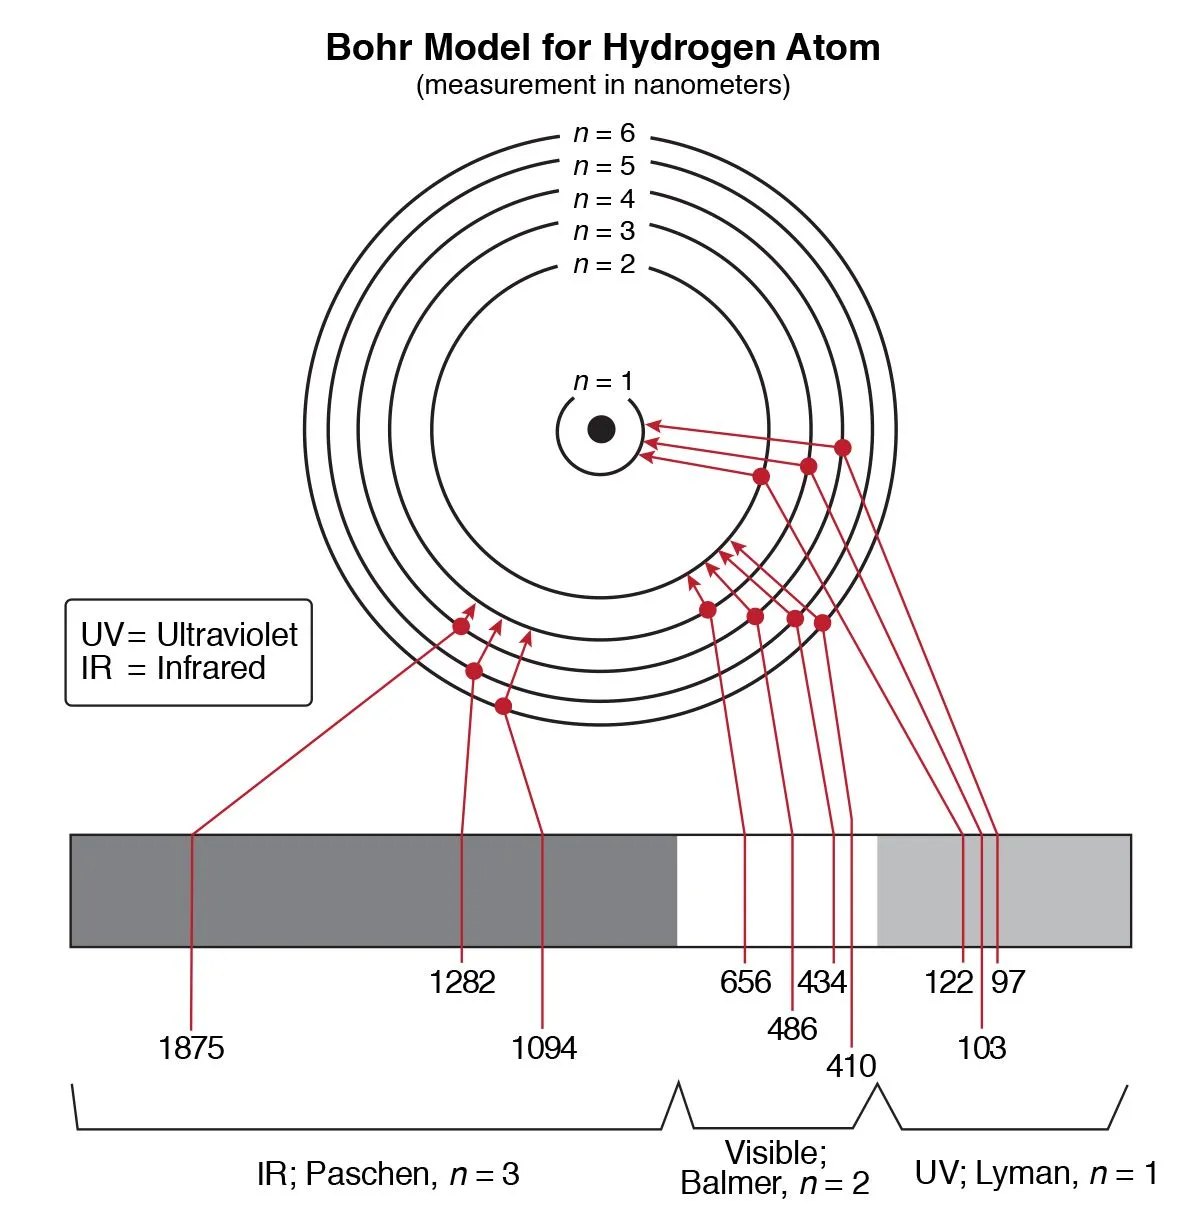
Figure 1 – Possible transitions
The emitted light’s color and wavelength (?) depend on the magnitude of the energy change (??) due to the transition from one energy level to another. This is shown in the equations below:
E is the energy difference (in Joules) between the 2 energy levels ?x and ?y, h is Planck’s constant (6.63 x 10⁻³⁴ J s), c is the speed of light (2.998 x 10⁸ m/s), and ? is the wavelength in meters. Normally, the wavelength is expressed in nanometers (nm) (1 nm = 10-9 m) or Angstroms (Å) (1 Å = 10-10 m or 0.1 nm).
An excited electron may return to the ground state (n = 1) or to any other lower excited state. The energy difference between levels gets smaller as levels increase. Transitions from excited states to the ground state (n = 1) involve much larger energy changes than do transitions to level 2 (n = 2).
In the gas discharge tube, a high-energy beam of electrons strike the ground state hydrogen atoms, promoting the electron in each atom to higher-energy levels. The electron may be promoted to different higher-energy levels in each hydrogen atom. Since the number of hydrogen atoms in the tube is very large, the subsequent dropping of electrons to lower-energy levels and the ground state produces all possible transitions. Some transitions occur more frequently than do others.
Moreover, a given hydrogen atom’s electron may undergo several transitions before it reaches the ground state, emitting several photons. This produces photons of many different wavelengths (the discrete lines we observe in the hydrogen spectrum) in the visible and other regions of the electromagnetic spectrum. The Lyman series lines occur in the ultraviolet region, the Balmer are in the visible region, and the Paschen and Brackett are in the infrared.
The wavelength of the photons emitted by the hydrogen atom may also be calculated using the Rydberg equation shown below.
RH is the Rydberg constant (1.097 × 10⁷ m-1) for hydrogen, n1 is the lower-energy level, and n2 is the higher-energy level.
Pre-activity questions
- The visible region of the electromagnetic spectrum lies between the wavelengths of ______ and ______ nm.
- A certain photon has a wavelength of 550 nm. Calculate its energy in Joules.
- Calculate the energy (J) and wavelength (nm) of the photon emitted by the 4?1 transition in a hydrogen atom.
- The Lyman series of lines in hydrogen’s emission spectrum are invisible to the human eye, but they can be detected photographically.
- The Lyman series of lines arise from transitions between higher excited states and level _____________________.
- These lines are found in the __________________ region of the electromagnetic spectrum.
Materials
- Spectroscope or Economy Quantitative Spectroscope
- Spectrum Tube Power Supply
- Hydrogen Spectrum Tube
- Spectrum Analysis Chart, or
- Spectrum Tube Set
Procedure
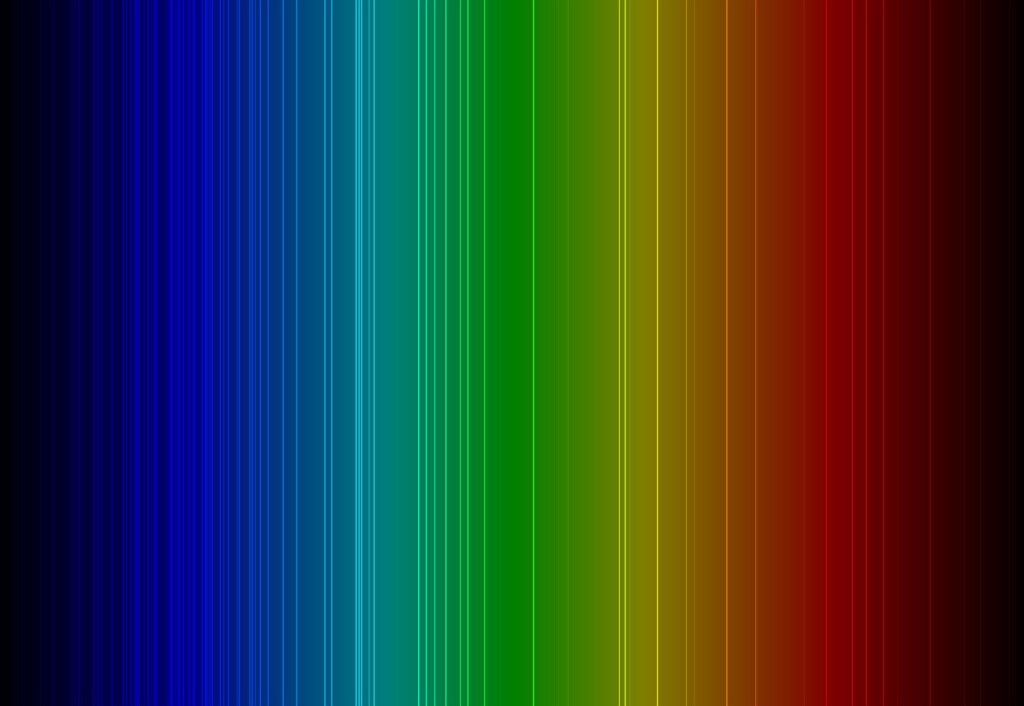
- Hydrogen’s emission spectrum will be observed by applying a high-voltage discharge to a tube filled with hydrogen gas and viewing the light emitted by the excited atoms with a spectroscope. The wavelengths of lines in hydrogen’s spectrum will be measured by reflecting the light from the spectroscope’s diffraction grating onto a ruled scale calibrated in nm.
- The instructor will set up and demonstrate the use of the spectroscope, power supply, and the function of the diffraction grating. When you start this experiment, the entire apparatus should be in place and properly adjusted by the instructor. Ask for assistance in readjusting the setup. Caution: Never touch the gas discharge tube while the power supply is on. The tube gets very hot during operation and will burn you if you touch it.
- Observe the hydrogen spectrum. In your data table (see Fig. 2), draw the lines you observe, recording their wavelengths and colors.
- Compare the observed spectrum with a known spectrum of hydrogen on the spectrum chart provided for reference in the lab.
- Using the spectroscope, observe an ordinary white incandescent light bulb.
Data table and calculations
Colors, wavelengths, and energies of lines in the hydrogen spectrum
Draw in the observed lines on the above scale and label the colors. Check observed wavelengths against those shown on the spectrum chart in the lab.
| Color Observed | Observed ? (nm) | Observed ? (m) | Energy Level Transition | Energy Change (?E) from Observed ? | Energy Change (?E) from Bohr Model |
Figure 2 – Data Table
Calculations (show your equations and calculations):
- Decide on the energy level transition, e.g., 6?1, for each of the observed wavelengths.
- Calculate the energy of the photon, which is the energy difference for the transition, from the observed wavelengths.
- Using the Bohr model equation, calculate the energy of each of the energy levels involved in the transition for each of the observed wavelengths.
- Calculate the energy difference for each transition based on the Bohr model.
- How well do the energy differences based on the wavelengths compare to the energy differences based on the Bohr model?
Answers to Pre-activity Questions
- 400 to 700 nm
- 3.62 x 10⁻¹⁹ J
- 2.04 x 10⁻¹⁸ J and 97.3 nm
- a) 1, b) ultraviolet
Sample Data Table
| Color Observed | Observed ? (nm) | Observed ? (m) | Energy Level Transition | Energy Change (?E) from Observed ? | Energy Change (?E) from Bohr Model |
| Red | 660 | 6.60 x 10⁻⁷ | 3?2 | 3.01 x 10⁻¹⁹J | 3.03 x 10⁻¹⁹J |
| Blue Green | 480 | 4.80 x 10⁻⁷ | 4?2 | 4.14 x 10⁻¹⁹J | 4.09 x 10⁻¹⁹J |
| Violet | 430 | 4.30 x 10⁻⁷ | 5?2 | 4.63 x 10⁻¹⁹J | 4.58 x 10⁻¹⁹J |
| Violet | 415 (may not be seen) |
4.15 x 10⁻⁷ | 6?2 | 4.79 x 10⁻¹⁹J | 4.84 x 10⁻¹⁹J |
Instructor notes
- It is helpful to set up the spectroscopes in a completely dark room. Students may only see 3 of the hydrogen emission lines. If they only see 3 lines, you can give them the 6?2 transition wavelength for their calculations.
- Students can compare the bright line spectrum of an excited gas to the continuous spectrum of a glowing solid by using the spectroscope to observe the spectrum of an incandescent light bulb.
- The visible photons in the hydrogen spectrum are the Balmer series lines. The lowest energy and longest wavelength photon corresponds to the 3?2 transition and is red. The higher-energy transitions produce shorter wavelengths and the color moves towards the violet end of the spectrum (4?2, blue green; 5?2 and 6?2, violet). Since the energy difference between the levels gets smaller at higher levels, the spectral lines get closer together. They merge into a band of unresolved wavelengths that are too short to see. The following diagram may be useful in discussing lab data.
Figure 3 – Wavelengths diagram


