Total Time: 30 mins
Prep: 15 mins | Activity: 30 mins

Physical Science, Earth and Space Science
Looking at Earth’s gravitational field is an interdisciplinary application of Newton’s law of universal gravitation and gravitational field strength concept. This activity illustrates the application of gravitational field strength to changes in topography across the Earth’s surface.
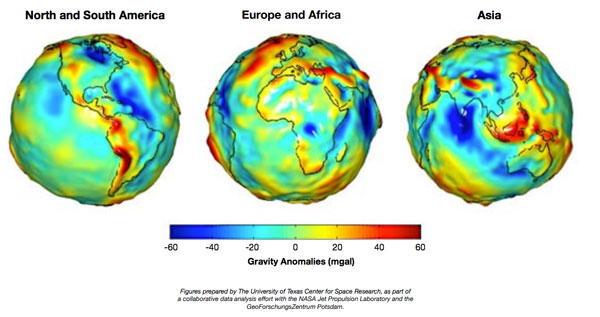
If Newton could have traveled across the entire Earth’s surface measuring the acceleration due to gravity, he would have discovered the same patterns shown in the GRACE satellite images. Today, the GRACE 1 and GRACE 2 satellites, traveling in tandem and very close together, take the necessary measurements and complete the analysis of gravitational field strength.
This activity drives home the relationship between mass and gravity through a simple visual examination that Newton established hundreds of years ago. Students should be familiar with the force of gravity, Fg, and acceleration due to gravity, g, the mathematical relationships established in both, and the interpretation of the values.
Newton demonstrated that the force of gravity, Fg, between two objects is attractive, directly proportional to the product of their masses, m1 and m2, and inversely proportional to the distance, d, between them squared.
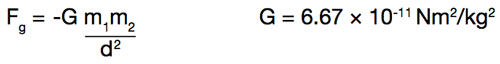
The masses of objects and the distance between them are key considerations for understanding the strength of the gravitational force. Newton’s formula can be applied to very large bodies like the Earth and moon system or even the Earth and sun system because of the substantial masses of the objects and the distances between them.
For less massive bodies on or near the Earth’s surface, we often use the local gravitational field of Earth, or g, the attractive force a body placed in Earth’s gravitational field experiences. The gravitational field strength at a given point is calculated as the gravitational force per unit of mass or:
g=F/m g=9.80665 N/kg F=in Newtons m=mass in kg
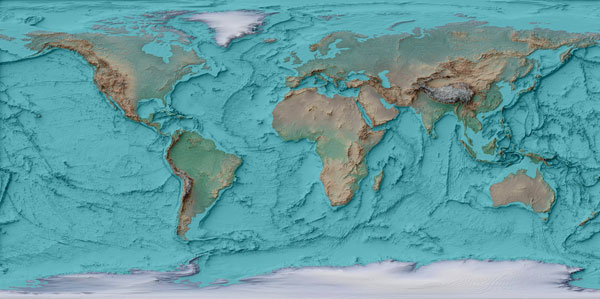
Since gravity is an attractive force and bodies near the Earth’s surface fall to Earth, g is also referred to as the average acceleration due to gravity. At sea level, the standard acceleration of gravity is 9.80665 m/s2. Latitude, altitude, and local geology can impact the value of g. Local variations in values of g are called anomalies. They are measured in units of milliGalileo, mgal, which has an acceleration value of about 1 × 10⁻⁶ g or 1 × 10⁻⁵ m/s2. The maps provided are color coded to indicate areas with higher (red), or lower (blue), than expected values of g. With imaging from GRACE satellites and a shaded relief map, students can establish and confirm patterns among Earth’s gravitational acceleration, topography, and geology. By examining gravitational anomalies compared to relief features, students quickly identify and confirm the relationship Newton established between mass and gravitational field strength.
What can you tell about the distribution of mass on Earth by looking at a relief map?
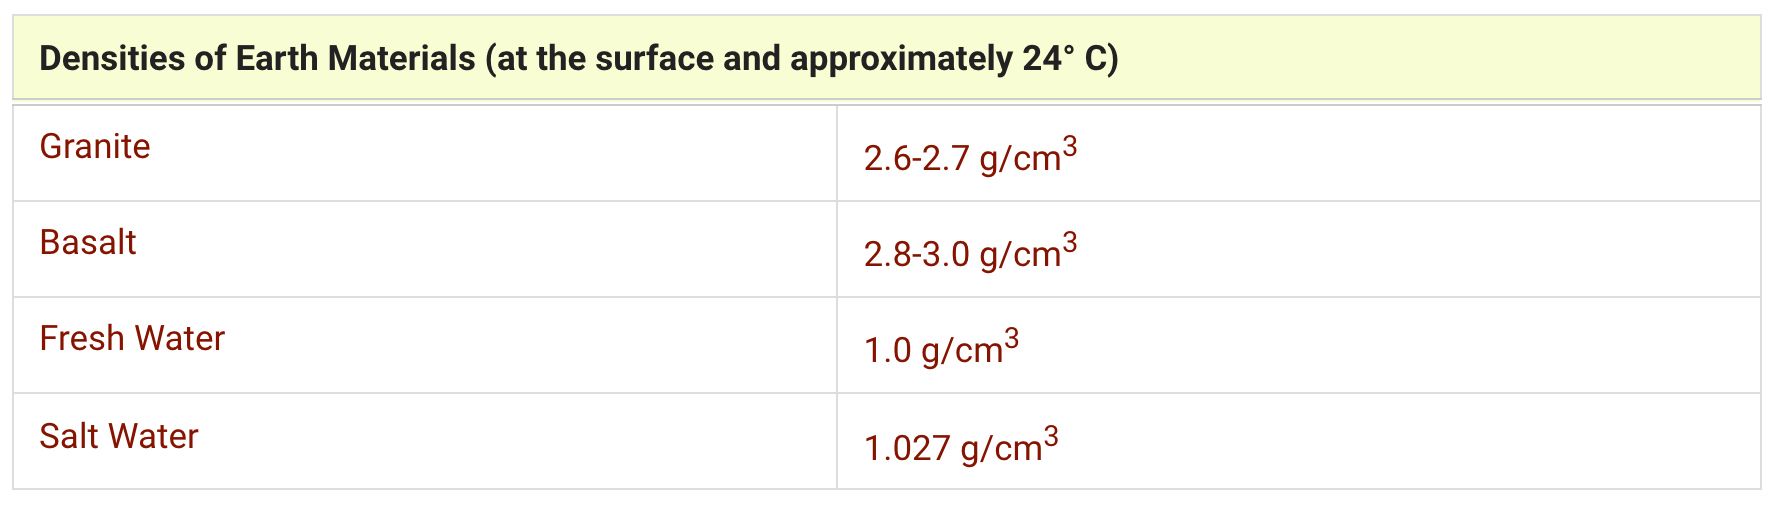
How can Newton’s law of universal gravitation be used to explain the anomalies in the global gravity field map? Use the table of densities to help support your claims.
Newton’s law of universal gravitation has the mass of 2 objects in the numerator. Based on the global gravity field maps and topographic or relief maps, it is apparent that mass is not evenly distributed across the globe. Water is less dense than the rocks that make up continents, which means that for the same amount of volume, water has less mass than rock.
As rock builds up or erodes away, mass is redistributed. As mass is redistributed, the gravity field changes. For example, as mass increases, like along a mountain chain, the magnetic field strength should increase. This is supported by the red color on the gravity field map indicating a positive anomaly. A decrease in mass or high volume of water, like in the Amazon basin, shows a negative anomaly since water is less dense than rock.