Modeling Lunar Phases
A Carolina EssentialsTM Activity

Total Time: 65-80 mins
Prep: 20 mins | Activity: 45-60 mins

Earth and Space Science
6-8
Middle School
- Total Time: 65-80 minutes [ Prep: 20 mins | Activity: 45-60 mins ]
- Subject: Earth and Space Science
- Grade: Middle School
Overview
In this activity, students collect data on the lunar phases using a simple Earth-sun-moon model consisting of a flashlight, a foam ball on a pencil, and a circle of paper divided into eighths. A student, holding the moon in constant position, rotates 45 degrees until returning to the starting position, resulting in a model of the moon’s phases. Photos or drawings document the moon phases, and then the cycle is used as a model to predict lunar phase dates for the next 3 lunar cycles.
Phenomenon
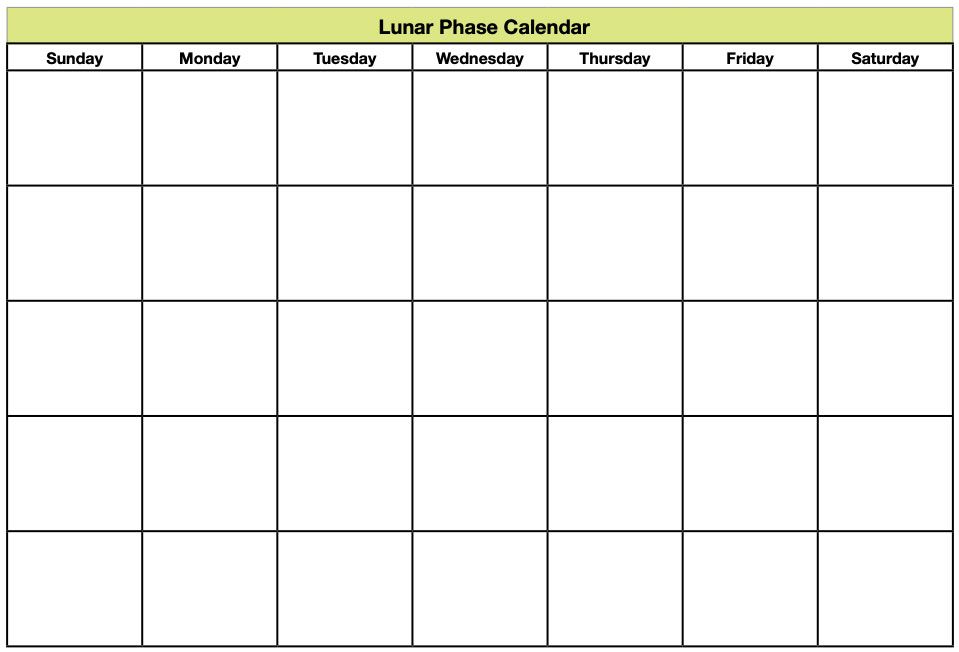
The following is a lunar cycle calendar. What patterns do you observe?

Essential Question
What causes the cyclical pattern of lunar phases?
Activity Objectives
- Develop a model of the lunar cycle.
- Draw or use photos to describe the pattern of lunar phases.
- Use the pattern to predict the dates of the next 3 lunar phase cycles.
Next Generation Science Standards* (NGSS)
MS-ESS1-1. Develop and use a model of the Earth-sun-moon system to describe the cyclic patterns of lunar phases, eclipses of the sun and moon, and seasons.
SCIENCE & ENGINEERING PRACTICES
Developing and Using Models
- Develop and use a model to describe phenomena.
DISCIPLINARY CORE IDEA
ESS1.A: The Universe and Its Stars
- Patterns of the apparent motion of the sun, the moon, and stars in the sky can be observed, described, predicted, and explained with models.
CROSSCUTTING CONCEPTS
Patterns
- Patterns can be used to identify cause-andeffect relationships.
Materials
- Square of bulletin board paper, 48 × 48 in (any color)
- Scissors
- Pencil or wood dowel, 1/2 × 10 in
- Foam ball, 3 in
- Flashlight or lamp
Safety Procedures and Precautions
No PPE is required for the activity.
Teacher Preparation and Disposal
Copy or upload the student activity guide. Assign students to groups (3–4 per group). All materials may be reused.
STUDENT PROCEDURES
- Take the piece of bulletin board paper and fold it in half, making a sharp crease.
- Fold the paper a second time to make it into a square again, making a sharp crease.
- Fold the paper a third time on the diagonal, making a cone shape. The cut edges of the paper should all be at the large opening of the cone. Make a sharp crease through all layers of the paper.
- Using the scissors, trim the wide end of the cone into a curve so it looks like a piece of pie or pizza.
- Completely unfold the paper. It should be a circle divided into 8 sections.
- Label one crease as 0°. Move to the left and label the next crease 45°. Continue labeling the creases, moving to the left each time—90°, 135°, 180°, 225°, 270°, 315°, and 360° (0° and 360° are the same crease).
- Position the lamp (the sun) on a table or desk 3 to 4 feet from the center of the circle. If using a flashlight, the person holding the flashlight needs to stand 3 to 4 feet from the center of the paper circle.
- Place the labeled circle on the floor with the 0° crease pointing to the lamp.
- Carefully, push the pencil into the middle of the foam ball (the moon).
- Stand on the center of the circle (Earth) with the 0° crease in line with the light.
- Turn on the lamp or flashlight (the sun) and turn off the room lights.
- Hold the pencil with the ball out at arm’s length, slightly higher than shoulder height, and in line with the 0° crease.
- Observe and sketch or photograph what the ball looks like from the center of the circle.
- Turn your whole body slowly to the left until you are in line with the 45° crease, and sketch or photograph the ball again.
- Repeat the process until you are back to the 0°/360° crease.
- If using photos, upload the photos to the data table.
TEACHER PREPARATION AND TIPS
- Precut the bulletin board paper in 48 × 48 inch squares. If using flashlights, check the batteries, and if using lamps, check the bulbs.
- Assign 3–4 students to a group—1 student for the lamp/flashlight, 1 to rotate with the foam ball, 1 to sketch or take photos, and 1 to direct.
- Demonstrate the paper folding if necessary.
- Emphasize numbering and rotating to the left. This is the direction the moon travels relative to Earth.
- You may want to share class sketches or photos before beginning the analysis and discussion.
- Inform students that they can check their lunar phase predictions nightly at home.
Data and Observations
Observations and Positions in Degrees

Analysis & Discussion
Analysis
Use your data table to explain the pattern of light and dark produced by the Earth-sun-moon model.
See the NASA diagram below.
Explain the differences between the lunar phase pattern you observed and the one presented in the phenomenon.
Student answers will vary, but the most obvious difference is the length of the cycle. The student-generated cycle is 8 phases long and the cycle in the phenomenon is 29 phases long.
Using your lunar phase model, explain why lunar phases happen.
See the NASA diagram below. Pay particular attention to the position of the moon relative to the sun and Earth.

NASA/JPL-CalTech “This graphic shows the position of the Moon and the Sun during each of the Moon’s phases and the Moon as it appears from Earth during each phase.”
Discussion
Use the lunar phase model charts to predict the date and phase of the next 3 lunar cycles.
Check student predictions after they happen through nightly observations, or use a lunar calendar to check prior to the date by selecting the month and year.

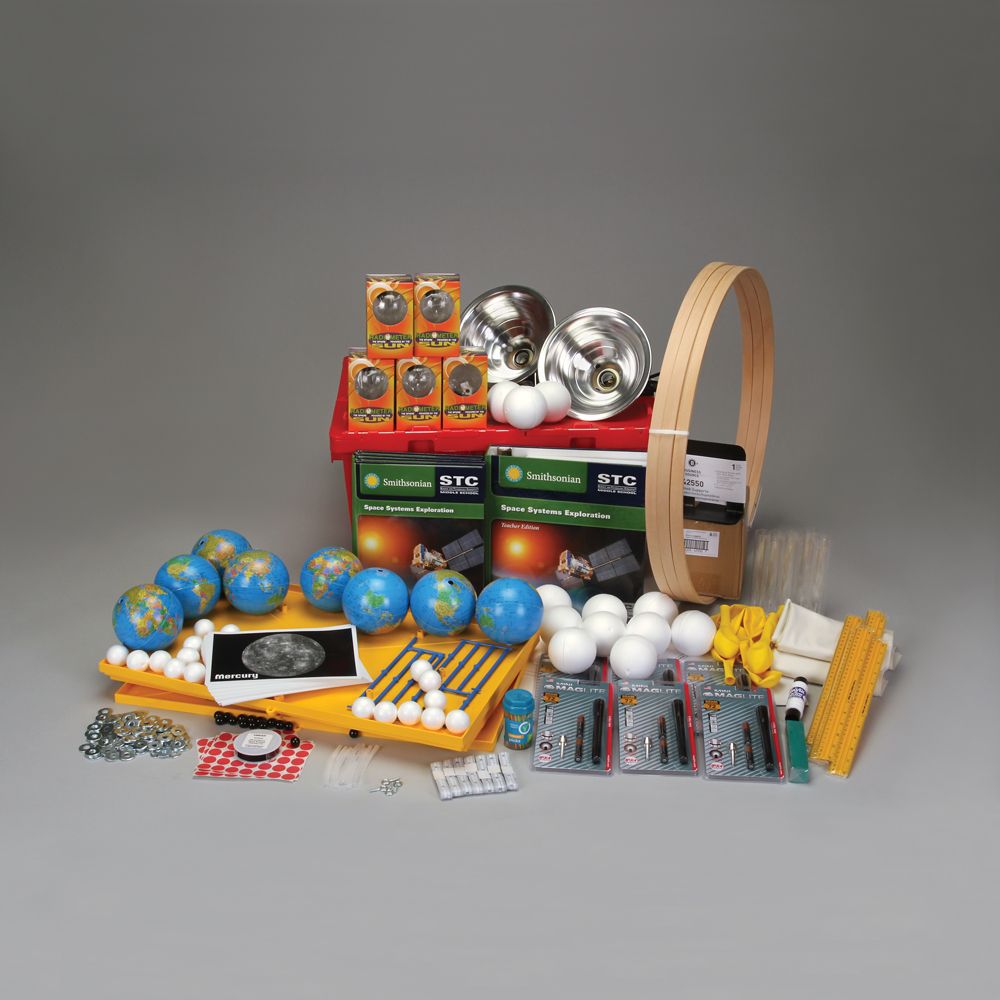
SHOP THE KIT
REFERENCE KIT
HELPFUL LINKS
- Sun, Earth, Moon Systems Model
- Moon Globe
- Board Set, Sun-Earth-Moon
- Historical Sunspot Activity: Finding Patterns
- The Great American Eclipse of 2023-2024
- Wireless Sun/Moon Forecast Station with Oscar Outlook
- Multimedia Earth Science Lessons for Interactive Whiteboards: The Sun-Earth-Moon System, Single User
VIEW MORE ESSENTIALS
*Next Generation Science Standards® is a registered trademark of Achieve. Neither Achieve nor the lead states and partners that developed the Next Generation Science Standards were involved in the production of, and do not endorse, these products.


