What factors have contributed to the rise in global temperatures over the past century?
Total Time
Prep: 20 mins | Activity: 45-60 mins
Earth Science
Grade Level
6-8 Middle School
Introduction
As human population has increased, manufacturing has increased, so has milage of paved roads, the numbers of concrete structures, and area of dark roof tops. Vegetation has been removed to make way for urbanization. How have these changes affected the amount of solar energy/heat energy absorbed on Earth’s surface? Do buildings and roads absorb and reflect the same amount of heat energy trees and water do? How does the amount of solar energy reflected by objects effect the temperature of an area? These are a few questions that need to be investigated to better understand changes in global temperature. In this activity, students will research changes in the miles of paved roads in the US and changes in population of urban centers. Research will continue with a quick investigation of infrared surface temperatures, (albedo, if you wish to introduce the concept) on the school campus, comparing the heat absorbed and reflected by a variety of surfaces. Students will analyze the data gathered and ask two research, (testable) questions on the heat island effect that you wish to pursue. They need to complete some reading on heat islands and albedo (optional).
Depending on resources and time, students can continue with independent research on their own question, or the class can crowd-source data to answer a single, class-selected question.
This is a thermal image and vegetative image of New York City. Notice the scales at the bottom of each image. What temperature/vegetation patterns can you find in the photos?
What factors have contributed to the rise in global temperatures over the past century?
Activity Objectives
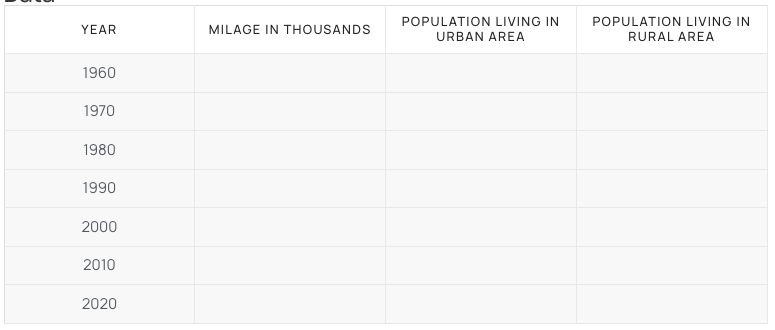
Complete research to determine the change in miles of paved roads in the US.
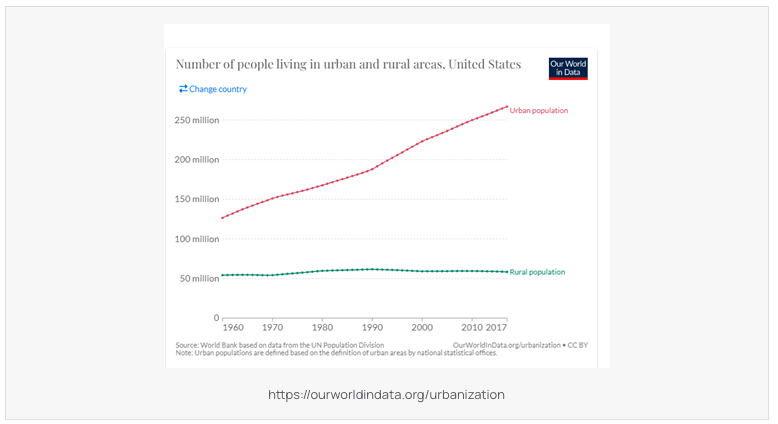
Complete research to determine the change in urban population in the US.
Ask a testable research question to investigate the phenomenon of heat islands.
Next Generation Science Standards* (NGSS)
PE: MS-ESS3-5. Ask questions to clarify evidence of the factors that have caused the rise in global temperatures over the past century.
SCIENCE & ENGINEERING PRACTICES
Asking Questions and Defining Problems
Ask questions to identify and clarify evidence of an argument.
DISCIPLINARY CORE IDEA
ESS3.D: Global Climate Change
Human activities, such as the release of greenhouse gases from burning fossil fuels, are the major factors in the current rise in Earth’s mean surface temperature (global warming). Reducing the level of climate change and reducing human vulnerability to whatever climate changes do occur depend on the understanding of climate science, engineering capabilities, and other kinds of knowledge, such as understanding of human behavior and on applying that knowledge wisely in decisions and activities.
CROSSCUTTING CONCEPTS
Stability and Change
Stability might be disturbed either by sudden events or gradual changes that accumulate over time.
Select and inspect areas on the school grounds before taking students to gather IR data. Minimize all safety concerns.
Teacher Prep and Disposal
Copy or upload the student activity guide and schedule computer time if needed. Select safe and easily accessible sites with a variety of surfaces for students to collect IR temperature data.
Student Procedures
Complete online research to gather data on the changes in total miles of paved roads in the U.S. and the total number of people living in urban areas.
Record the sources of information you used.
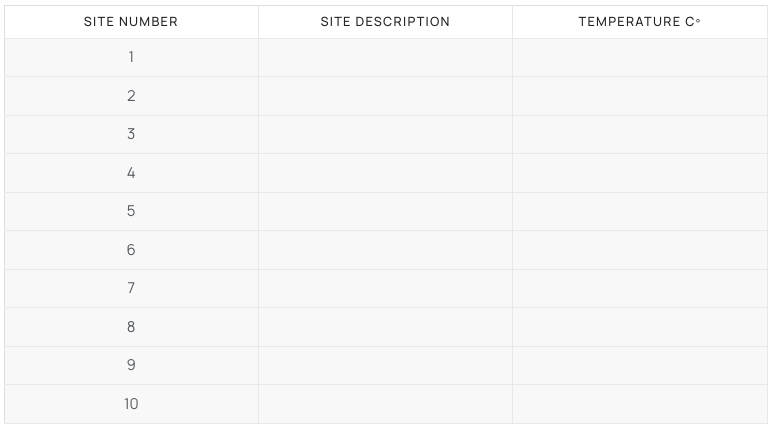
Get an infrared themometer and take the temperature of a black piece of paper and a white piece of paper.
Select 5-10 different sites, as your teacher instructs. Make sure to test a variety of surfaces, concrete, asphalt, grass, leaf litter, shade, full sun, dark colors, light colors, black and white.
Review the data and generate 2 testable questions, that when answered, could help establish the effect surface type and color, miles of pavement, and population may have on the phenomenon of heat islands and changes in global temperatures.
Complete further research as your teacher directs.
Teacher Preparation and Tips
Download and post or print the student activity guide.
Select safe places, with a variety of surface types and colors for students to gather data. Have black and white paper available to test. Paper testing should be completed before going to test sites to ensure student can use the IR thermometer correctly.
Optional: Share class IR data to increase the size and variety of surfaces tested.
Have a class discussion about the questions students generate to investigate heat islands.
Inform students if they will be investigating their own question or a class question.
Set parameters for continued research into heat islands and their effect on changes in global temperature.
What patterns do you see in miles of paved road and numbers of people living in urban areas?
Student data will vary. Roads (access to urban areas/urban sprawl) have increased and so has the number of people living in urban areas.
What patterns do you see in IR temperature data based on site characteristics?
Student data will vary.
Discussion
Review the data and generate 2 testable questions, that when answered, could help establish the effect surface type and color, miles of pavement, and population may have on the phenomenon of heat islands and changes in global temperatures.
Student questions will vary. Look for testable questions that require scientific investigation not a question that can be answered by looking it up.
Complete further research as your teacher directs.
513601 STC-Middle School™, STC3 Edition: Ecosystems and Their Interactions
Buy the Kit
STC-Middle School™, STC3 Edition: Ecosystems and Their Interactions Replacement Parts
We are committed to providing the lab kits, instructional materials, and often free activities and supporting digital resources that do as much heavy lifting for you as we can.
*Next Generation Science Standards® is a registered trademark of Achieve. Neither Achieve nor the lead states and partners that developed the Next Generation Science Standards were involved in the production of this product, and do not endorse it.
Get the latest news, free activities, teacher tips, product info, and more delivered to your inbox.
We value your privacy
We use cookies to enhance your browsing experience, serve personalized ads or content, and analyse our traffic. By clicking "Got It", you consent to our use of cookies. Privacy Policy