Factors That Affect Reaction Rate
A Carolina EssentialsTM Demonstration

Total Time: 45-60 mins
Prep: 15 mins | Activity: 30-45 mins

Physical Science, Chemistry
9-12
High School
- Total Time: 45-60 minutes [ Prep: 15 mins | Activity: 30-45 mins ]
- Subject: Physical Science, Chemistry
- Grade: High School
Overview
This activity serves as a student-based or teacher-led phenomenon that will lead to making sense of how reaction rates can be changed. Three factorsconcentration, temperature, and particle sizeare observed for their effect on reaction rates. In student groups or through a teacher demonstration, the 3 factors are manipulated (9 total reactions) and simple time measurements recorded.
The activity is introductory and not meant to answer the how-or-why questions of variable reaction rates but simply to let students observe and gather evidence that reaction rates can be manipulated. The materials used, Alka-Seltzer® and water, are probably familiar to many students, so they can concentrate on how the reaction rate changes and not on the reaction itself. Time measurements are made using the disappearance of the antacid and the appearance of carbon dioxide bubbles. In a quantitative lab, change in concentration of either a reactant (disappearance) or product (appearance) would be measured over time.
Phenomenon
Ask students these questions and allow for brief discussion in groups before beginning the demonstration.
- Identify a few common reactions that you are familiar with. Cooking an egg, cooking meat, bleaching clothes, mixing vinegar and baking soda, burning gasoline in a car engine, burning a log.
- Can the reaction rate (how fast or slow the reaction is) be changed? Students may or may not say yes. At the end of the demonstration, they should have an answer. Additional investigations can build an explanation for the how and why of reaction rate variation.
- What may be able to change the reaction rate? Answers will vary, but some typical ones may include temperature, how big the reactant is, and how thick the reactant is.
Essential Question
Can the rate at which a reaction occurs be changed?
Activity Objectives
- Collect evidence to determine if reaction rates can be manipulated.
- Collect evidence of the effect concentration, temperature, and particle size have on reaction rate.
Next Generation Science Standards* (NGSS)
HS-PS1-5. Apply scientific principles and evidence to provide an explanation about the effects of changing the temperature or concentration of the reacting particles on the rate at which a reaction occurs.
SCIENCE & ENGINEERING PRACTICES
Constructing Explanations and Designing Solutions
- Apply scientific principles and evidence to provide an explanation of phenomena and solve design problems, taking into account possible unanticipated effects.
DISCIPLINARY CORE IDEA
PS1.B: Chemical Reactions
- Chemical processes, their rates, and whether or not energy is stored or released can be understood in terms of the collisions of molecules and the rearrangements of atoms into new molecules, with consequent changes in the sum of all bond energies in the set of molecules that are matched by changes in kinetic energy.
CROSSCUTTING CONCEPTS
Patterns
- Different patterns may be observed at each of the scales at which a system is studied and can provide evidence for causality in explanations of phenomena.
Materials
- 5 individual Alka-Seltzer® tablets
- 3 specimen jars, 4 oz.
- 3 jar caps, 58 mm
- Mortar and Pestle, 60 mL
- Hot plate or access to a microwave
- 3 beakers, 1000 mL
- Warm water, 1000 mL (40–50° C)
- Tap water, 1000 mL (20–25° C)
- Cold water, 1000 mL (5–15° C)
Safety Procedures and Precautions
Students should wear safety goggles to prevent splash hazards.
Teacher Preparation and Disposal
Pre-cut and grind the Alka-Seltzer® tablets prior to the demonstration to save time. All reaction products may be disposed of down the sink.
STUDENT PROCEDURES
- If doing a demo, fill in the times for each reaction in the data table. If doing the activity in groups, your teacher may assign you 1 variable to investigate, or you may do all 3.
- Temperature
A. Break 2 tablets into equal halves. Keep unused halves in the foil package to minimize a reaction with water in the air.
B. Label the jar caps as tap, warm, and cold.
C. Fill each jar ¾ full of water at the appropriate temperature and cap it.
D. Place a half tablet in the jar labeled “Warm” and immediately begin timing. Record when bubbles are first observed and when the tablet is completely reacted.
E. Complete the reaction with tap water and cold water and record the same information.
- Concentration
A. Break a tablet into equal halves. Break a half into halves (¼ tablet). Keep the pieces in the foil package to minimize a reaction with water in the air.
B. Label the jar caps as whole, ½, and ¼.
C. Fill each jar ¾ full of tap water and cap it
D. Place the whole tablet in the jar labeled “Whole” and immediately begin timing. Record when bubbles are first observed and when the tablet has completely reacted.
E. Complete the reaction with the ½ tablet and tap water and the reaction with the ¼ tablet and tap water. Record the same information.
- Particle Size
A. Break 2 tablets into equal halves. Keep unused halves in the foil package to minimize a reaction with water in the air.
B. Label the jar caps as whole, chunks, and powder.
C. Fill each jar ¾ full of tap water and cap it.
D. Place the unbroken ½ tablet in the jar labeled “Whole” and immediately begin timing. Record when bubbles are first observed and when the tablet is completely reacted.
E. Break ½ of a tablet into chunks. Complete the reaction with the chunks and tap water. Record the same information.
F. Crush ½ of a tablet into powder using the mortar and pestle. Complete the reaction with the tablet powder and tap water. Record the same information.
TEACHER PREPARATION AND TIPS
- If completing the activity as a demo, have all of the tablets pre-cut and powdered and the jar caps labeled. If time is an issue, you can run all of the reactions simultaneously with 9 students serving as timers.
- To save time, assign a variable (temperature, concentration, or particle size) to groups of students and then combine class data. This is recommended.
- Bubbles will appear almost immediately except in the experiment. You may want to define “immediately” as 0.01 seconds.
- If multiple groups are completing the same variable, you may average group data before making a class data table.
- Crush the tablets with a small hammer if you don’t have a mortar and pestle.
Data and Observations
Student times will vary. See the trend below in discussion question 1 for relative time differences.
Group Data

Class Data

Analysis & Discussion
State the relationship between each variable and reaction time.
As the temperature went up, the time decreased so the rate increased. As the amount of Alka-Seltzer® decreased, the time increased so rate decreased. As the particle size got smaller, the time decreased so the rate increased.
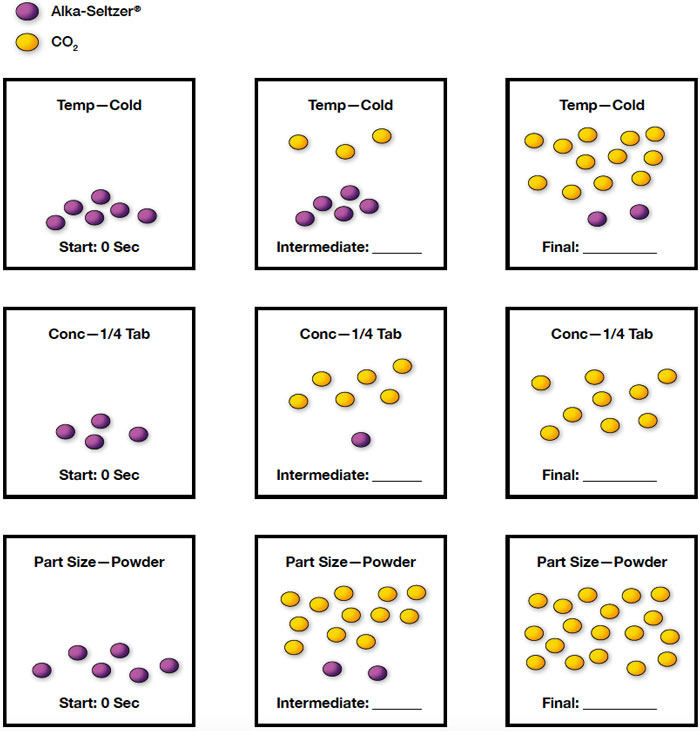
Use a series of particle diagrams to illustrate the variable you were assigned and the relationship between the variable and reaction rate you discovered. Use a single symbol for Alka-Seltzer® and a single symbol for carbon dioxide. You do not have to show every atom. Color or symbol code the particles.
There is a 1:3 ratio of Alka-Seltzer® to carbon dioxide, which should be pointed out to students not familiar with stoichiometric ratios. Single trial examples:

SHOP THE KIT
SAFETY REQUIREMENTS
- Safety Goggles Required
HELPFUL LINKS
VIEW MORE ESSENTIALS
*Next Generation Science Standards® is a registered trademark of Achieve. Neither Achieve nor the lead states and partners that developed the Next Generation Science Standards were involved in the production of, and do not endorse, these products.


