Succession on Mount St. Helens
A Carolina EssentialsTM Activity

Total Time: 45-60 minutes
Prep: 15 mins | Activity: 45-60 mins

Life Science | Earth and Space Science
9-12
High School
Overview
This data analysis and data visualization exercise uses a small portion of data generated by the biologist Roger del Moral from the University of Washington, Seattle. Students analyze the eruption and biotic changes on Mount St. Helens since the 1980 eruption to produce evidence for the succession stage directly after the eruption and 30 years past.
Event Summary
On May 18, 1980, Mount St. Helens erupted. The energy of the blast equaled 24 megatons of TNT, and it destroyed everything on the mountain within 8 miles. The eruption column rose 80,000 feet in less than 15 minutes and consisted of molten, high-pressure gas and steam mixed with rock.
Geologists classified the erupted material as pumice, lightweight and porous volcanic rock, and tephra, rock fragments sized from ash (2 mm) to bombs (64 mm). The eruption cloud spread across the United States in 3 days and circled the planet in 15 days! The energy from the eruption melted most of the snow and glaciers at the top of the mountain, which resulted in severe lahars (volcanic mudflows). One of the lahars was reported to be 12 feet deep. Between the eruption and resulting lahars, the surface of Mount St. Helens was scoured, top soil was removed in blast areas, and a large proportion of living organisms was killed.
Phenomenon
Ask students to watch the video of the Mount St. Helens eruption and generate questions they would need to investigate or explain what has happened to the mountain since the eruption. What do you need to know or study to understand the impact of the environmental changes on the mountain? Take a few minutes to discuss student ideas and questions before introducing the activity.
Essential Question
How are scientific data used to evaluate the impact of environmental changes on the number and types of species, including humans, in a given location?
Activity Objectives
- Use geologic data to identify the topographic changes to Mount St. Helens after the 1980 eruption.
- Use data of species abundance to classify and evaluate the stages of succession on Mount St. Helens.
- Identify immediate and long term impacts the Mount Saint Helens eruption had on the local human population, US population, and world population.
Next Generation Science Standards* (NGSS)
PE HS-LS4-5. Evaluate the evidence supporting claims that changes in environmental conditions may result in: (1) increases in the number of some species, (2) the emergence of new species over time, and (3) the extinction of other species.
ESS PE: HS-ESS3-1. Construct an explanation based on evidence for how the availability of natural resources, occurrence of natural hazards, and changes in climate have influenced human activity.
SCIENCE & ENGINEERING PRACTICES
Engaging in Argument from Evidence
- Construct an explanation based on valid and reliable evidence obtained from a variety of sources (including students’ own investigations, models, theories, simulations, peer review) and the assumption that theories and laws that describe the natural world operate today as they did in the past and will continue to do so in the future.
DISCIPLINARY CORE IDEA
ESS3B: Natural Hazards
- Natural hazards and other geologic events have shaped the course of human history; they have significantly altered the sizes of human populations and have driven human migrations.
CROSSCUTTING CONCEPTS
Cause and Effect
- Empirical evidence is required to differentiate between cause and correlation and make claims about specific causes and effects.
Materials
- Data Tables
- Graph paper
- Colored pencils
Teacher Preparation and Disposal
The species abundance data table is lengthy. Assign a plot to a pair or group of students to graph and share the results with the whole class. Copy the species abundance data table and cut it into sections for students prior to class.
STUDENT PROCEDURES
A. Eruption Analysis Procedures
- On the circle below, draw each of the ordinal directions (N, NNE, NE, ENE, E, ESE, SE, SSE, S, SSW, SW, WSW, W, WNW, NW, NNW). There is an angle of 22.5° between each direction.
- Using a single colored pencil, design a key for the different types of impact found in the Eruption Data Table.
- Using a second colored pencil, design a key for the different types of deposition found in the Eruption Data Table.
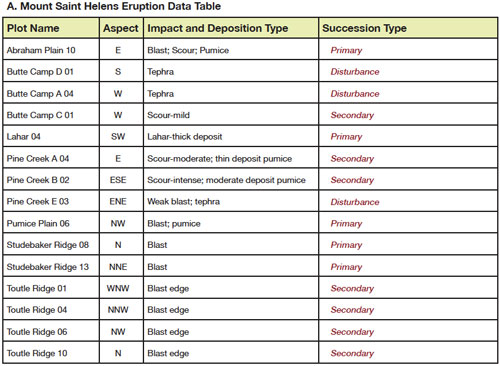
- Using the Mount St. Helens eruption data, construct a map using aspect, impact type, and deposition type.
B. Mount St. Helens Succession Data
- Obtain a succession study plot data table from your teacher. Record your assigned plot.
- On the same set of axes, plot the average percent cover by plants for all 6 species. Use a different color for each species.
TEACHER PREPARATION AND TIPS
- You may want to draw a compass rose on the board for students who have not had an earth science class.
- Let students know that contrasting colors will provide better visual data.
- A fill pattern in a contrasting color will make the types of deposition easier to see.
- Make certain students are plotting all the plant species on the same set of axes. They need to compare species.
Data and Observations
Analysis & Discussion

A. Eruption Data
Using your eruption analysis, summarize the impact the eruption had on the topography of the mountain.
The NW to E side of the mountain was blown out, leaving a gaping hole. The SW sector was covered in a mudslide. The areas not blown out by the eruption had deposits of tephra or pumice.Using the diagram and data table, predict the type or stage of succession (primary, secondary, or disturbance) each plot was in directly after the eruption. Place your answer on the Eruption Data Table.
B. Succession Data

1. Use the graph of average number of species over time to describe the process of succession for your assigned plot.
Student answers will vary depending on the plot they have. In general, all plots took time before there was evidence of plant life returning. Different plots had different plants, at different times depending on the amount of damage, type of depositions, and aspect of the plot.
2. Based on your graph, identify what type or stage of succession your assigned plot is in. What evidence supports your claim?
Student answers will vary, but they should be the same as predicted using the damage and deposition chart and diagram.
3. Examine the class succession graphs. Are all the plots on Mount St. Helens the same successional type or stage? What evidence supports your answer?
The plots are not all at the same successional level. Looking at the graphs, some plots only have pioneer species growing. In addition, the first segment of the graphs indicates how long it was before plant life emerged, and these segments are not all the same length.
C. Generalizations
1. Did the eruption data and succession data lead to the same conclusion for type or stage of succession? Use evidence to support your claim.
Student answers will vary but both sets of data should produce the same conclusion. The degree of damage to the area is related to the stage of succession-more damage gives earlier stage of succession.
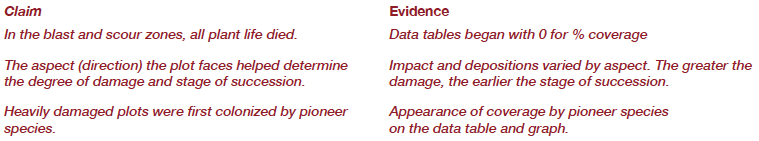
2. Using evidence to support your claim, argue how the eruption of Mount St. Helens affected the type and number of plant species directly after the eruption through 2009.
Students answers may vary. (Sample claims with evidence are below.)
3. Using evidence to support your claim, argue how the eruption of Mount St. Helens affected human populations locally, within the continental United States, and globally. Identify if the affects were immediate or long term.
Student answers will vary but may include:
- Loss of human life- immediate, local
- Loss of logging jobs- immediate, local with national impacts
- Water pollution to drinking water reservoirs- immediate and long term, local to regional impact
- Air pollution with associated respiratory problems- immediate and for weeks to months, local, regional, US and global impacts
- Loss of tourism related jobs- immediate and long term, local impact
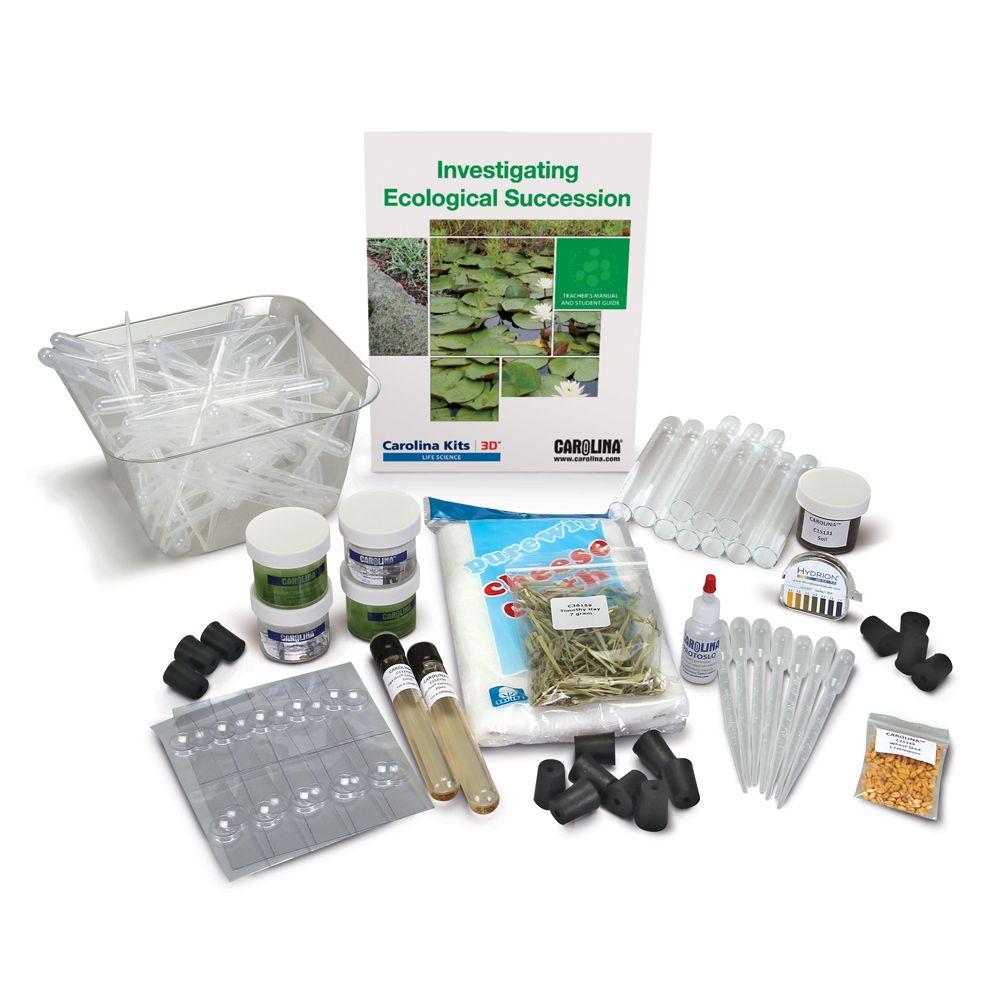
SHOP THE KIT
HELPFUL LINKS
VIEW MORE ESSENTIALS
*Next Generation Science Standards® is a registered trademark of Achieve. Neither Achieve nor the lead states and partners that developed the Next Generation Science Standards were involved in the production of, and do not endorse, these products.
About The Author
Carolina Staff
Carolina is teamed with teachers and continually provides valuable resources–articles, activities, and how-to videos–to help teachers in their classroom.