Teaching the Scientific Method with Effervescent Tablets
|
Carolina Staff
|
Carolina Staff
|
Introduction
We innately explore, observe, question, and experiment to understand our environment. Children demonstrate this propensity at an early age by asking endless “why” and “how” questions—the genesis of a systematic process of thought and investigation referred to as the scientific method. In this simple activity, your students will learn the steps of the scientific method as they investigate the endothermic reaction of effervescent tablets dissolving in water.
10 Alka-Seltzer® Tablets (or similar effervescent tablets)
4 Disposable Cups or 250-mL Beakers
Water
1 Laboratory Thermometer or Temperature Probe
Background
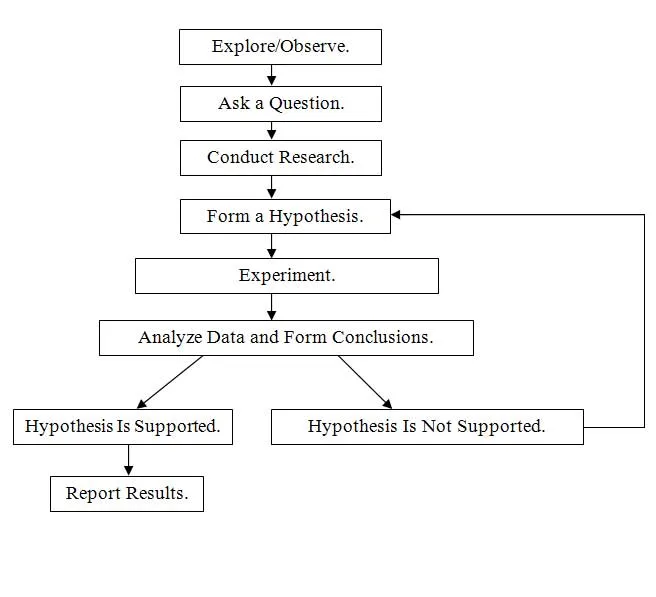
The steps of the scientific method are outlined in a flowchart below. Note the pathway for revisiting the hypothesis and creating a new one if the first one is not supported by the experiment.
Fig 1 Scientific method flowchart
NGSS Standards
Grades 9-12
SEPs
• Asking Questions and Defining Problems
• Developing and Using Models
• Planning and Carrying Out Investigations
• Analyzing and Interpreting Data
DCIs
• PS1.A: Structure and Properties of Matter
• PS1.B: Chemical Reactions
• PS2.B: Types of Interactions
• PS3.B: Conservation of Energy and Energy Transfer
• PS3.D: Energy in Chemical Processes and Everyday Life
Safety
Use safety glasses or goggles when conducting this investigation.
Procedure
Guide your students in doing the following activities.
Observation
Place 50 mL of water from the same source in each of 4 cups or beakers. Stir the water in each with the thermometer and ensure that the water in each cup or beaker is at the same temperature. Record this as the temperature with 0 tablets.
Place a thermometer in the water of the first container, add 1 effervescent tablet, and stir until the solution temperature remains constant.
Record the temperature with 1 tablet.
Ask a question
Why did the temperature of the water decrease when an effervescent tablet was added?
Conduct research
If you were to do research, you would find that dissolving certain substances in water may be exothermic (releasing heat) and certain others, endothermic (absorbing heat).
Hypothesis
Because the temperature of water drops after an effervescent tablet dissolves in it, the reaction must be endothermic. Hypothesis: I think that increasing the number of tablets added to a series of identical 50-mL samples of water (from the same source and maintained at the same temperature) will decrease the temperature of each solution by an amount proportional to the number of tablets added.
Experiment
Following the process you used with 1 tablet in the first container, you will add tablets to a container, stir while measuring the temperature until it remains constant, and then record the reading.
First, verify that the temperature of your remaining 3 water samples has not changed.
Add 2 tablets to the second container, stir, monitor the temperature until it stabilizes, and then record it.
Likewise, add 3 tablets to the third container and follow the steps.
Add 4 tablets to the last container and follow the steps.
Number of Tablets
Temperature (°C)
0
23.0
1
20.2
2
18.0
3
16.0
4
14.0
Figure 2 Sample data table.
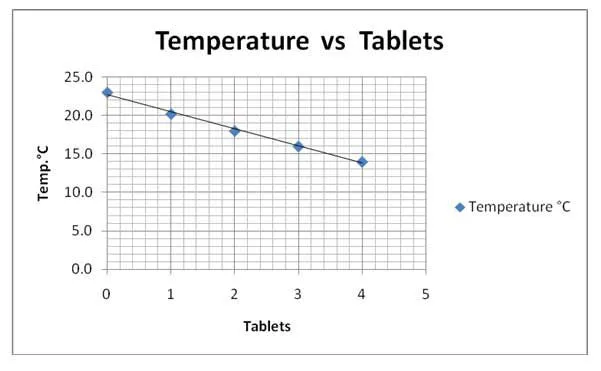
Figure 3 Sample graph: water temperature vs. number of tablets.
Data analysis and conclusions
The graph of the data supports the hypothesis. The data confirm direct relationship between the increase in number of tablets and the decrease in temperature.
Share results
Have the student groups compare their data as a class. Are there any significant discrepancies? If so, discuss possible reasons.
Student assessment
What is the independent variable? The number of tablets.
What is the dependent variable? The water temperature.
What is a controlled variable in this experiment? The water volume of 50 mL is 1. (Others include same initial temperature, same water source, and the same thermometer or temperature probe.)
How did the dependent variable respond to the independent variable? Water temperature decreased proportionally as more tablets were added.
Based upon the trend of your graph, what would you predict as the final temperature if 5 tablets were dissolved in 50 mL of water at room temperature? 12° C.
Extension
Get more tablets and have students test another variable. For example, the independent variable might be volume of water and the dependent variable, temperature. A controlled variable would be number of tablets (1 per trial).
Find the slope of the temperature-versus-tablets graph to quantify the temperature decrease in degrees per tablet.
Use a temperature probe with real-time graphing to monitor the temperatures for each trial.
Carolina is teamed with teachers and continually provides valuable resources–articles, activities, and how-to videos–to help teachers in their classroom.