Tired of counting pennies to plot a half-life curve? This activity takes less time than counting pennies, uses equipment you already have, involves cooperative group work, and allows your students to run multiple trials.
This activity simulates the decay of a radioactive element. Water flows from a buret following a first-order reaction rate, the same order rate as radioactive decay. As a radioactive substance decays, it forms a new isotope. The amount of water delivered from the buret represents the new “daughter” isotope, whereas the water remaining in the buret represents the amount of undecayed “parent” isotope. Plot both parent and daughter isotope data on the same graph, with mL on the y-axis and time in min on the x-axis. The point where the 2 lines intersect represents the 1st half-life of the parent isotope. Read the 2nd half-life from the graph and use it to assess the accuracy of the graph.
Table 1: Volume of Water Delivered from a Buret
| Time/Minutes | Buret Reading/mL | Volume Delivered/mL | Volume Remaining in Buret/mL |
|---|---|---|---|
| 0 | 0.5 | 0.0 | 20.5 |
| 0.5 | 3.5 | 3.0 | 17.5 |
| 1 | 6.1 | 5.6 | 14.9 |
| 1.5 | 8.6 | 8.1 | 12.4 |
| 2 | 10.7 | 10.2 | 10.3 |
| 2.5 | 12.6 | 12.1 | 8.4 |
| 3 | 14.3 | 13.8 | 6.7 |
| 3.5 | 15.7 | 15.2 | 5.3 |
| 4 | 16.9 | 16.4 | 4.1 |
| 4.5 | 17.9 | 17.4 | 3.1 |
| 5 | 18.7 | 18.2 | 2.3 |
| 5.5 | 19.3 | 18.8 | 1.7 |
| 6 | 19.9 | 19.4 | 1.1 |
| 6.5 | 20.4 | 19.9 | 0.6 |
| 7 | 20.7 | 20.2 | 0.3 |
| 7.5 | 21.0 | 20.5 | 0.0 |

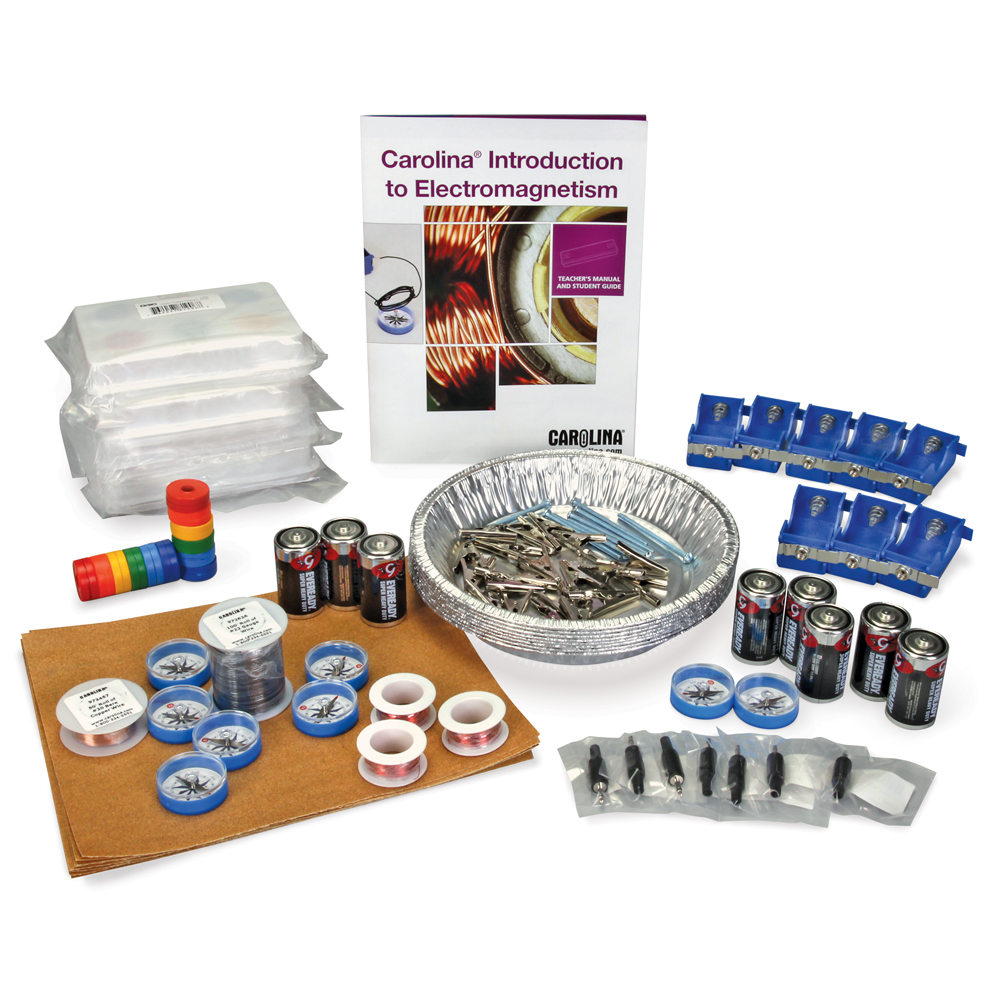
Carolina® Introduction to Electromagnetism
Students learn how electromagnets power everyday devices and get to build a simple motor and even their own working audio speaker.

Product Manager, Chemistry
Get the latest news, free activities, teacher tips, product info, and more delivered to your inbox.