Kinematics is the study of the motion of an object without consideration of the force or energy that cause the motion. This is one of the first topics covered in most physics and physical science courses and is addressed in NGSS PS2: Forces and Motion:
A: Forces and Motion
B: Types of Interactions
C: Stability and Instability in Physical Systems
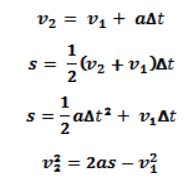
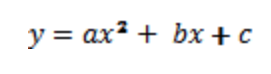
The motion of objects is described mathematically with four variables and a few equations:
Where: s is the displacement of the object a is the acceleration of the object; the rate of change of velocity v1is the velocity of the object at time t1 v2is the velocity of the object at time t2 ∆t is the time interval between time t2 and time t1
Working problems with constant acceleration can be challenging. Use the following activity to introduce the concept of constant acceleration in a general physics, conceptual physics, or physical science class.
Background
In most first-year physics courses, experiments involving constant acceleration likely will rely on the acceleration due to gravity (g = 9.8m/s2). Many of those experiments, including the one in this article, are versions of experiments performed by Galileo Galilei in the 16th century. According to legend, around 1590 Galileo dropped 2 cannonballs from the Leaning Tower of Pisa to demonstrate that falling objects accelerate at the same rate. It is not clear if this experiment actually happened, or if this was a thought experiment. About 400 years later, in 1971, Apollo 15 astronauts performed a similar experiment, dropping a hammer and a feather on the surface of the moon in the vacuum of space.
As Galileo attempted to analyze the motion of accelerating objects, one problem he faced was how to make observations on objects moving quickly. He lacked the benefit of modern time-keeping devices such as stopwatches. Galileo needed to slow down the motion of the falling object. Rolling balls of different masses down a ramp allowed Galileo to slow the motion of the balls. By measuring the time, it took the balls to roll down different lengths of the ramp and analyzing the data, Galileo was able to determine that the position of the ball at a given time was proportional to the square of the time.
Driving Question
How are the mathematical equations that model the motion of objects developed?
Objective
Objective: analyze the motion of a ball rolling down a ramp, similar to Galileo’s experiment.
*Another option for collecting and analyzing data is to record video of the ball as it rolls down the ramp. Most video software applications will allow you to advance the video slowly and will have a clock for recording time data.
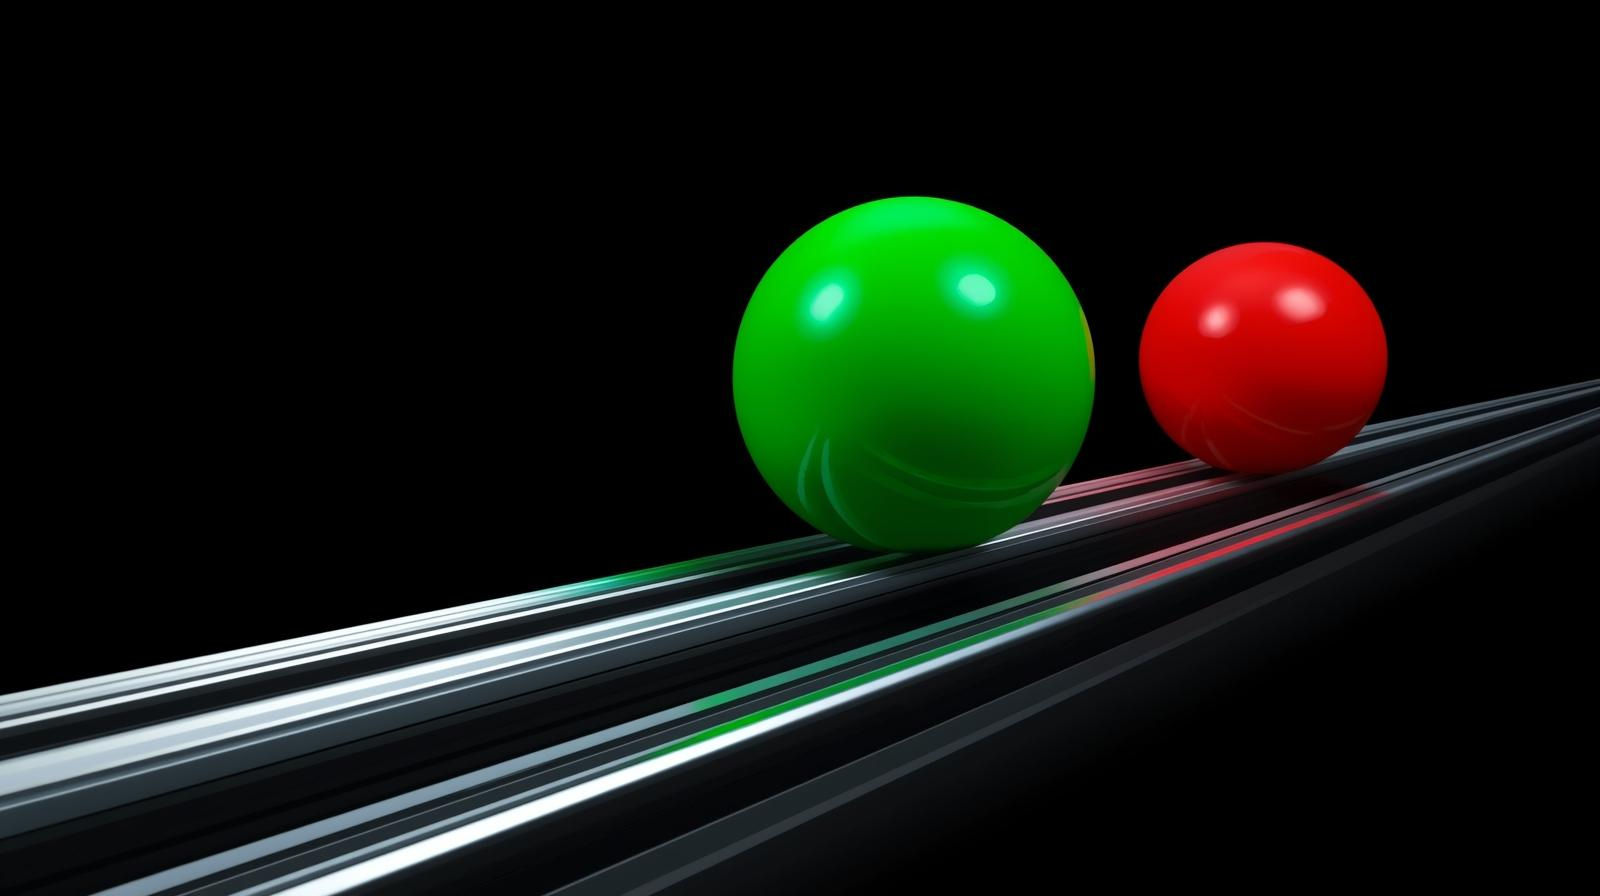
Provide students with one piece of foam board, 10 rubber bands, and 2 or more balls, spheres, or marbles of the same diameter but different masses.
Procedure
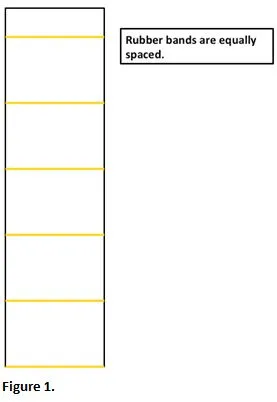
Draw a series of lines at 4” intervals across the short dimension (width) of the foam board.
Place rubber bands around the foam board so that each rubber band covers one of the lines. See Fig. 1.
Set up the foam board as a ramp by placing one end on a book and the other end on a level surface. The angle between the board and the level surface should be 5° to 15°.
Roll one of the balls down the ramp and listen to the sounds made as the ball crosses each rubber band. Try to roll the ball down the ramp as straight as possible. Catch the ball when it reaches the lower end of the ramp.
The time interval between the sounds will decrease as the ball rolls down the ramp because the ball picks up speed, it accelerates. The increasing frequency of the sounds as the ball crosses the evenly spaced rubber bands means the ball is covering the same distance in increasingly shorter time intervals.
Now challenge students to change the placement of the rubber bands on the foam board, spacing them in such a way that the amount of time it takes the ball to travel between the rubber bands is the same. The amount of space between each successive rubber band should increase so the ball covers a greater distance over equal time intervals.
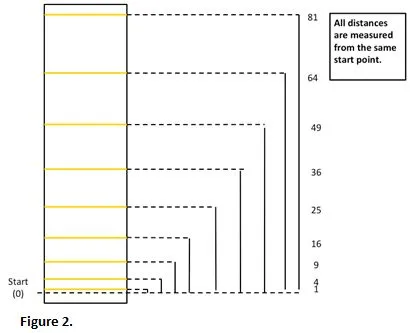
For students who need help, here are some suggestions to guide them toward the correct spacing (see Fig. 2).
Method 1: Remove all rubber bands from the foam board. As before, set up the foam board as a ramp. Place the ball on the ramp about 4” from the lower end of the board. Release the ball and measure the time it takes the ball to reach the bottom of the ramp. Record the time. Then place the ball 8” from the bottom. Again, release the ball and record the time it takes the ball to roll to the end of the ramp. Continue the process, each time increasing the distance of the ball from the end of the ramp by 4”. Have students graph the data, with the time values on the x axis and the distance on the y axis.
Method 2: Another option is to use a motion sensor. Set the motion sensor at the bottom end of the ramp with the sensor directed up the ramp. Set up the probeware and the supporting software to collect data from the rolling ball and generate a graph of distance vs. time.
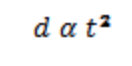
Students with some background in algebra and geometry should recognize the shape of the graph generated by either method as a parabola. This means the equation that describes the motion of the ball will be in the general form of a parabola.
The shape of the parabola will depend on the angle at which students set up their ramp. The exact equation for the motion of the ball is not important. What is important is that the students’ graph has distance on the y axis and time on the x axis. Therefore, the distance that the ball travels is proportional to the time squared.
The correct solution should have the rubber bands spaced according to the data in Table 1. Each distance is measured from the same starting point.
Table I
1
4
9
16
25
36
49
64
81
This activity provides a good introduction to kinematics and classical mechanics. It is also a good way to introduce the concept of acceleration to students with all levels of math skills. For a more compact set-up, look at the Visual Scientifics Kinematics series. Multiple experiments can be completed on one base that is laid out in a grid format and holds individual experimental apparatus for motion, collisions, projectile motion, pendulum, and loop for conservation of energy experiments.
Extension activities
Extend this lesson by using different angles and different masses, just as Galileo did. For more information on these topics, see the links below:
Product Management Coordinator for Physical Science
*Next Generation Science Standards® is a registered trademark of Achieve. Neither Achieve nor the lead states and partners that developed the Next Generation Science Standards were involved in the production of, and do not endorse, these products.
Carolina is teamed with teachers and continually provides valuable resources–articles, activities, and how-to videos–to help teachers in their classroom.