Help your students understand spectroscopy with these hand-on lab activities.
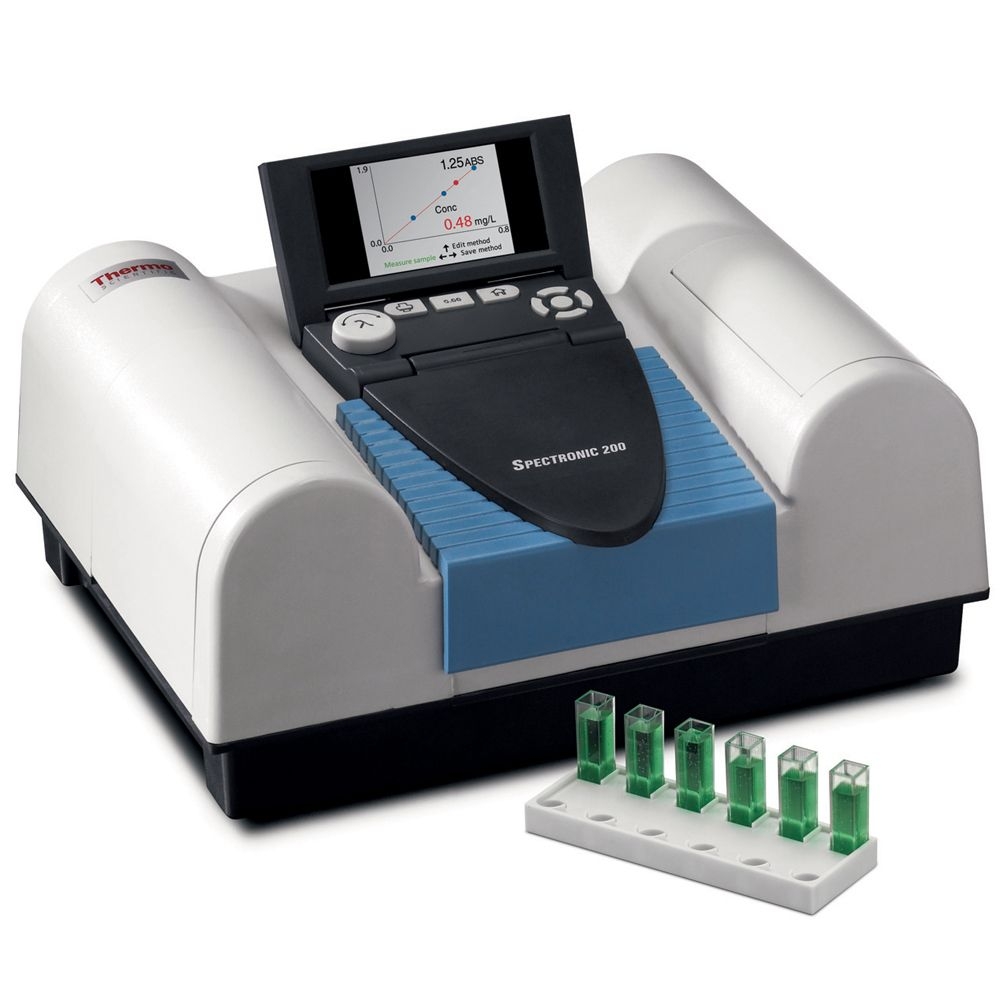
Here are 4 engaging hands-on lab activities from Thermo Fisher Scientific that use the Spectronic® 200 Spectrophotometer to help your students understand spectroscopy. Each activity has been fully tested to ensure reliable, accurate results. Extensive background material is provided for each experimental concept, including the chemistry involved and its application to a real-world situation. Lab report worksheets are also provided to help students record and analyze their results. Designed for high school and college students, these activities range in difficulty from novice to advanced, requiring different skills and content backgrounds.
For distance learning, you can video someone performing the activities and make the videos available to your students online. Further engage students by providing them with the experimental data and having them use it to perform graphical analysis, data analysis, error analysis, and calculation of unknowns.
The activities are listed below. Click a title to view and download the activity. We hope that you and your students find them to be engaging, informative, and fun.

This activity is a great introduction to spectroscopy. The background information explains color perception and its relationship to the wavelengths of visible light, so students gain an understanding of the importance of color in daily life. The differences between absorbance and transmittance is used to develop the concept of Beer’s law. During the activity, students use food dyes to establish the maximum absorbance for each color, reinforcing the concepts of absorbance and transmittance. Lab data are analyzed with plots and Beer’s law is verified.
Kinetics of Blue Dye with Hypochlorite Bleach
Take spectrophotometry to the next level with this activity. Background information explains the physical and chemical properties of dyes and the importance of the structure of the dye molecule, or chromophore. The chemical reaction that occurs when bleach is added to a dyed fabric is an indication of an oxidation reaction. Spectrophotometer data on color change and a Beer’s law curve provide evidence of the order of reaction with respect to the dye.
Note: The next 2 lab activities are more advanced and require a command of basic chemistry lab technique and mastery of metal coordination chemistry.
Spectrophotometric Determination of Trace Iron in Solution
This experiment simulates measuring iron in solution for environmental compliance in waste material or natural sources. Students use the concentration of Fe2+ to assess environmental compliance; and the concentration of total iron is measured after Fe3+ is reduced to Fe2+.
Brass, an alloy, is a mixture of metals whose ratios can vary. This experiment compares 3 different brass samples by dissolving brass in a solution and measuring absorbance. As the ratio of elements changes, absorbance values change also.
Additional Reading: Colorful Dyes from the Natural World
About The Author
Carolina Staff
Carolina is teamed with teachers and continually provides valuable resources–articles, activities, and how-to videos–to help teachers in their classroom.

