Skip to content
Disciplines
Close Disciplines
Open Disciplines
Explore
Earth, Space, & Environmental Science
Interdisciplinary
Life Science
Physical Science
Everything
Explore
Earth, Space, & Environmental Science
Interdisciplinary
Life Science
Physical Science
Everything
Classroom Support
Close Classroom Support
Open Classroom Support
Labs & Activities
Product Support
Lab Skills
Infographics
Living Care Guides
Safety
Professional Development
Videos
Labs & Activities
Product Support
Lab Skills
Infographics
Living Care Guides
Safety
Professional Development
Videos
Shop Science
Exclusives
Close Exclusives
Open Exclusives
Carolina Essentials
Lab Skills
Timeless Tips
Living Care Guides
Carolina Correlations
Carolina Essentials
Lab Skills
Timeless Tips
Living Care Guides
Carolina Correlations
About
Close About
Open About
About Carolina
Brands & Partners
Curriculums
About Carolina
Brands & Partners
Curriculums
Login
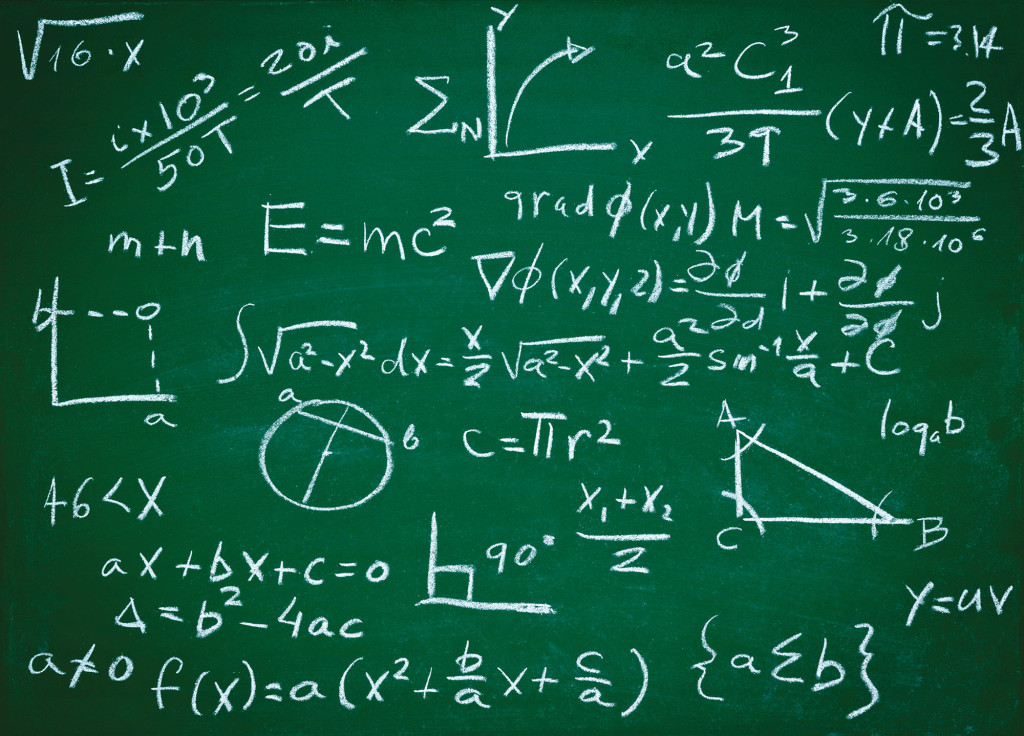
Category: Math
Filter by
Don’t Quote Me on That: Math Attitude Card Sort
Newton’s Law of Cooling
Introducing the Chi-Square Test Through Inquiry
What Is a Light Year?
The Basics of Graphs and Charts
Webinar: Making Sense of Inheritance Data
Gathering, Visualizing, and Interpreting Data
Very Trendy: Analyzing Data
Derivation of the Kinematics Equation
Disciplines
Explore
Earth, Space, & Environmental Science
Interdisciplinary
Life Science
Physical Science
Everything
Classroom Support
Labs & Activities
Product Support
Lab Skills
Infographics
Living Care Guides
Safety
Professional Development
Videos
Exclusives
Carolina Essentials
Timeless Tips
Lab Skills
Living Care Guides
Carolina Correlations
About
About Carolina
Brands & Partners
Did You Know?
Curriculums
Login / Register
Shop Science
Newsletter Signup
Get the latest news, free activities, teacher tips, product info, and more delivered to your inbox.
By Subject
Subject Tags
Allied Health
(
0
)
Anatomy & Physiology
(
0
)
AP Biology
(
0
)
AP Chemistry
(
0
)
AP Environmental Science
(
0
)
AP Physics
(
0
)
Biology
(
0
)
Biotechnology
(
0
)
Chemistry
(
0
)
CTE
(
0
)
Earth Science
(
0
)
Ecology
(
0
)
Environmental Science
(
0
)
Forensic Science
(
0
)
Genetics
(
0
)
Genomics
(
0
)
Geography
(
0
)
Life Science
(
0
)
Math
(
0
)
Microbiology
(
0
)
Physical Science
(
0
)
Physics
(
0
)
Physiology
(
0
)
Space Science
(
0
)
By Resource
Article Type
Activity
(
0
)
Carolina Essentials
(
0
)
Case Study
(
0
)
Demonstration
(
0
)
Digital
(
0
)
Dissection Resources
(
0
)
Lab Sheets
(
0
)
Lab Techniques
(
0
)
Phenomenon Driven
(
0
)
Remote Learning
(
0
)
Webinar
(
0
)
White Paper
(
0
)
Workshop Resources
(
0
)